NexaFlowAnalytics Platform
We redesigned the analytics experience to help product teams understand user behavior faster, reduce reporting complexity, and increase decision-making confidence.
The problem worth solving
Fragmented Data
Teams were switching between multiple tools to gather insights.
Slow Reporting
Generating reports took hours and delayed decision making.
Low Visibility
Executives lacked a clear overview of business performance.
Poor Collaboration
Departments worked in silos with inconsistent metrics.
What I owned end-to-end
ZEITPLAN
Jan 2025 - Aug 2026
TEAMGRÖSSE
7 People
MEIN TITEL
Lead Product Designer
KUNDE
Merdiaian Group
Research
- User interviews
- Competitor analysis
- Stakeholder workshops
- Analytics audit
Design
- User flows
- Wireframes
- Design system
- Interactive prototypes
Wie wir dorthin kamen
Ein 8-monatiger Sprint über Entdeckung, Design und Lieferung – mit einer harten Vorgabe: Die erste Version musste Excel vom ersten Tag an ersetzen, nicht schrittweise ablösen.
Discovery
Interviewed 20 customers and mapped pain points across reporting workflows.
Research
Analyzed competitor products and identified opportunities for simplification.
Wireframing
Created low-fidelity concepts to validate dashboard structure.
Design
Built a scalable design system and high-fidelity interfaces.
Launch
Released the platform to beta users and gathered performance insights.
Womit Nutzer tatsächlich zu kämpfen hatten

Sarah Johnson
Product Manager
“Finding meaningful insights used to take hours. Now it takes minutes.”

Michael Chen
Founder
“The dashboard became our single source of truth.”
Wichtigste Forschungsergebnisse
Most users preferred consolidated reporting experiences.
Over 60% of executives reviewed reports from mobile devices.
Teams wanted flexible filtering and export capabilities.
Für Vertrauen und Geschwindigkeit entwickelt
Farbpalette
Typografie-Skala
Komponentenbeispiele
Das Produkt im Detail



Was es anders macht
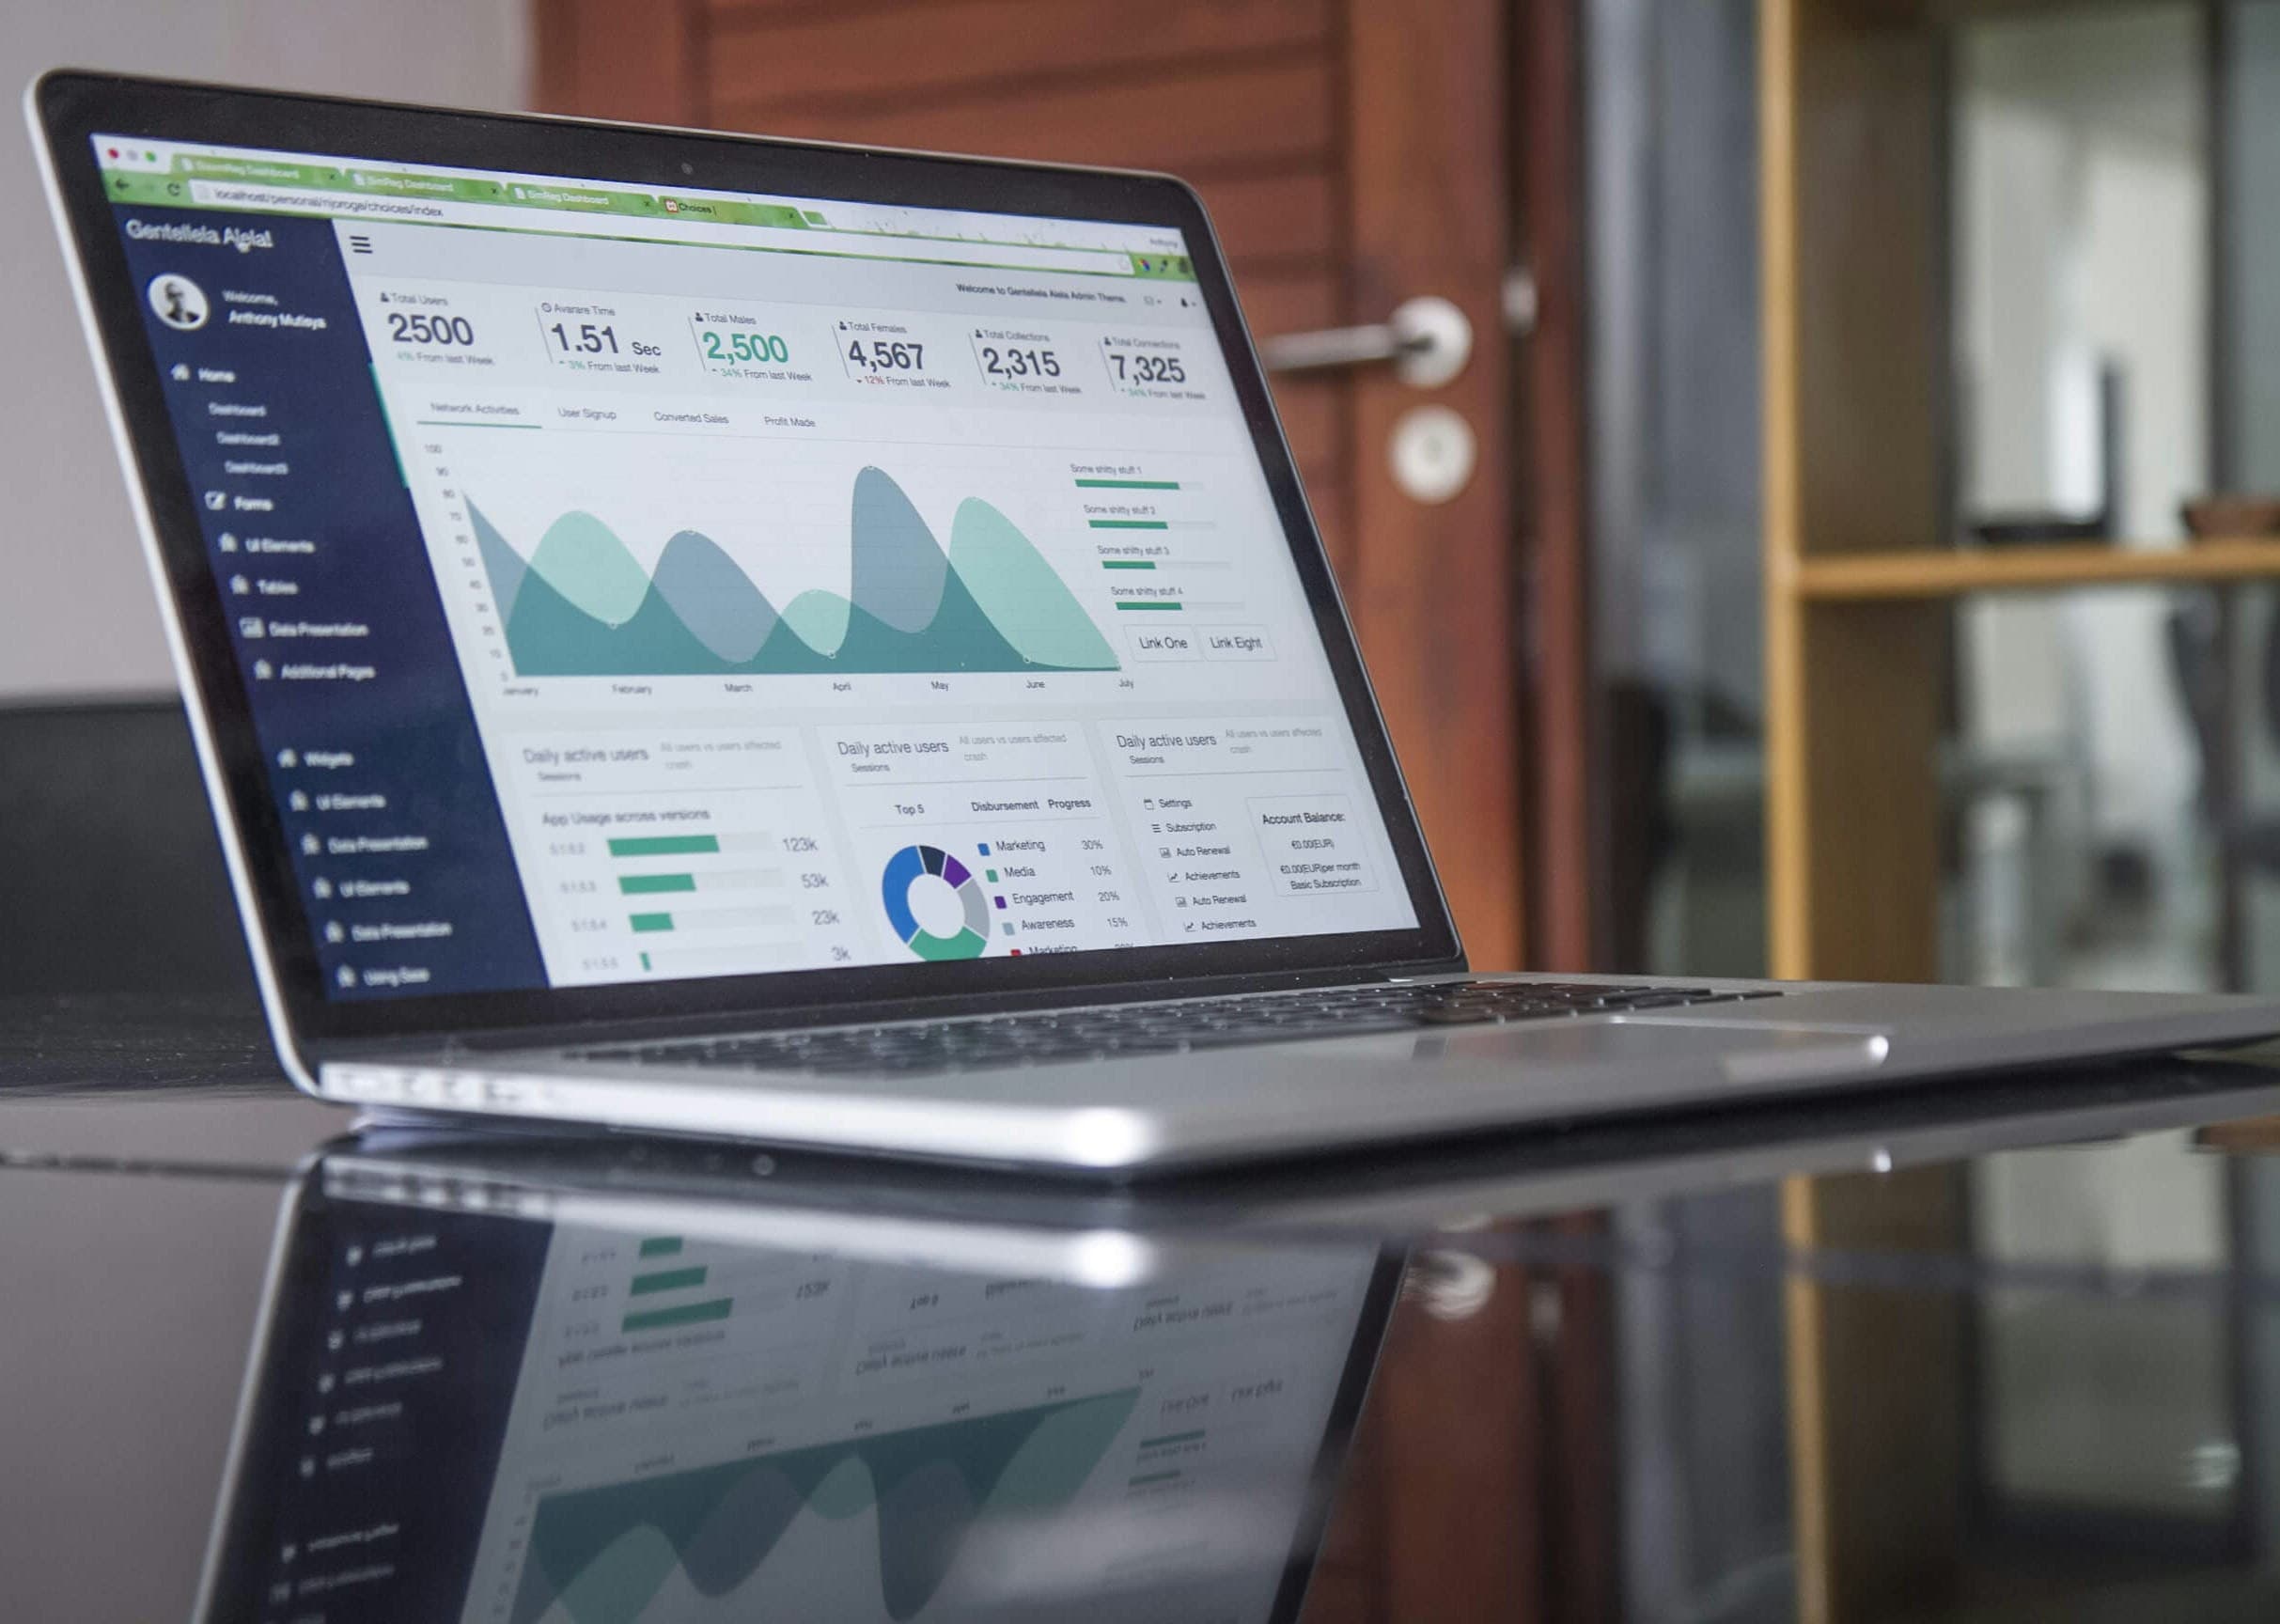
Real-Time Analytics
Monitor customer activity as it happens.
Enterprise Security
SOC2 compliant infrastructure and role-based access.
Fast Performance
Dashboard loads in under 1 second.
Custom Dashboards
Build tailored reporting experiences.
Zahlen nach sechs Monaten im Live-Betrieb
Increase in Reporting Efficiency
Revenue Tracked
Support Tickets Reduced
Customer Satisfaction
User Adoption after 8 Week
Based on 1200 Users
Was das Team gesagt hat
Nostrum aut elit qu
Qui provident id a
Non molestias eos ut · Sit autem assumenda
“Ipsam consequuntur c”
Et quidem expedita p
Laborum Elit et eu · Voluptas dolorem cor
“Vero quam eius et do”
Qui eveniet ea in i
Non vitae suscipit q · Excepturi excepteur
Womit es gebaut wurde
Frontend
Database
Backend
UI
Infrastructure
Herausforderungen & Erkenntnisse
Herausforderungen
Large Data Volumes
Millions of records required optimized aggregation pipelines.
Dashboard Performance
Charts needed to load instantly across devices.
Erkenntnisse
Simplicity Wins
Reducing complexity improved user adoption significantly.
Research First
User interviews prevented unnecessary feature development.